Because you have a craving for exceptional annual reports that are fresh and creative, precise yet imaginative, pleasing while highly informative. Because you are tired of run-of-the-mill reports that do not catch your audience’s attention. Because you are different, better, innovative and you want it to show!
why me?
Because you have a craving for exceptional annual reports that are fresh and creative, precise yet imaginative, pleasing while highly informative. Because you are tired of run-of-the-mill reports that do not catch your audience’s attention. Because you are different, better, innovative and you want it to show!
Consistent
Style
Guide
font // print
Headline 1 (H1)
Headline 2 (H2)
A style guide is important when creating reports to provide consistency and professionalism. It ensures that all reports follow the same structure, language, formatting, and terminology. This helps to avoid misunderstandings, improves readability, and strengthens brand or organizational recognition. Additionally, a style guide facilitates teamwork by providing clear guidelines for writing texts.
color
01
# 014751
75%
50%
25%
02
# 5C5592
03
# 9C1C51
04
# 4DB378
05
# C8D419
Consistent
Style guide
font // print
Headline 1 (H1)
Headline 2 (H2)
A style guide is important when creating reports to provide consistency and professionalism. It ensures that all reports follow the same structure, language, formatting, and terminology. This helps to avoid misunderstandings, improves readability, and strengthens brand or organizational recognition. Additionally, a style guide facilitates teamwork by providing clear guidelines for writing texts.
color
01
# 014751
02
# 5C5592
03
# 9C1C51
04
# 4DB378
05
# C8D419
75%
50%
25%
Tidy
Texts
The correct handling of scientific texts is essential to maintain their precision and significance. All formatting, special characters, formulas, etc., must be accurately reproduced, as even small deviations can lead to misunderstandings or errors. A clean presentation ensures that complex content remains clearly understandable and that scientific standards are upheld.
superscripted
subscripted
special character
bold
italic
underlined
Tidy
Texts
The correct handling of scientific texts is essential to maintain their precision and significance. All formatting, special characters, formulas, etc., must be accurately reproduced, as even small deviations can lead to misunderstandings or errors. A clean presentation ensures that complex content remains clearly understandable and that scientific standards are upheld.
superscripted
subscripted
special characters
italic
bold
underlined
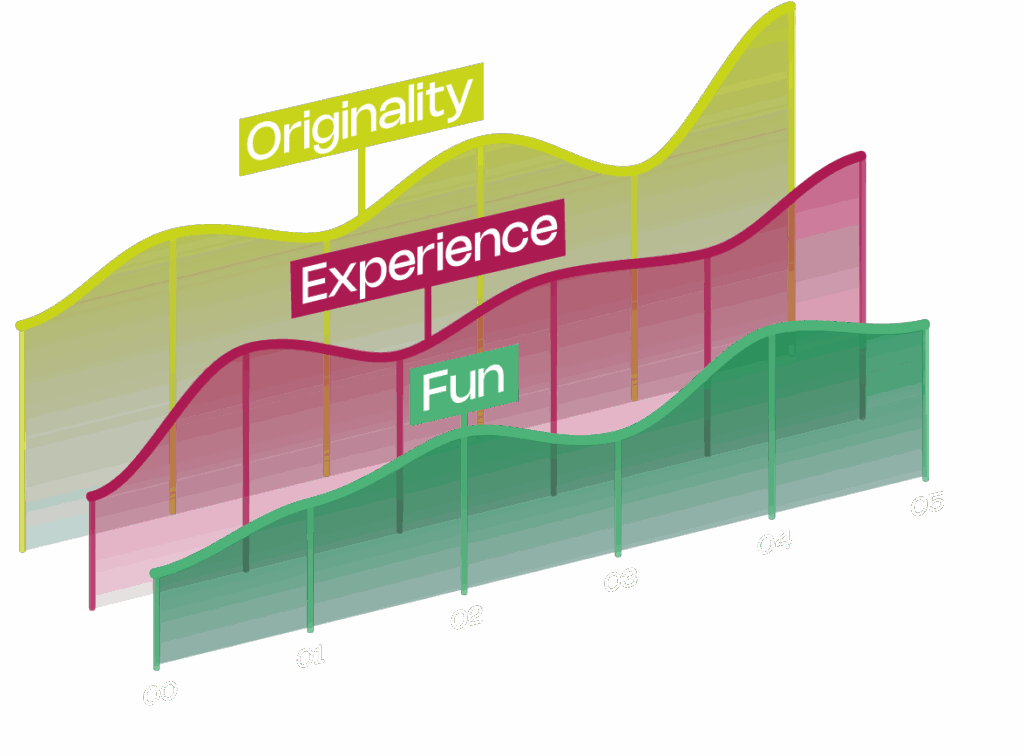
Vivid
Visuals
Hand Drawn
Iconic Icons
Info Grafics
World of Science
Graphics and illustrations serve to visually support information. They simplify complex data, clarify relationships, and enhance understanding. They capture attention and present content in an easier accessible and more memorable way.
Vivid
Visuals
Graphics and illustrations serve to visually support information. They simplify complex data, clarify relationships, and enhance understanding. They capture attention and present content in an easier accessible and more memorable way.
Hand Drawn
Info Graphics
Iconic Icons
World of Science
True
Data
Tables and charts are small information wonders, as they make complex data understandable at a glance. Tables provide a structured overview of figures, revenues, or statistics, while charts visualize trends, developments, and correlations. Their ability to transform large amounts of data into clear visual representations makes them indispensable.
Precise Tables
Tea Type
Rank
(Consumption)
Average Price ($)
Caffeine Strength
Steeping Time (min)
Optimal Temperature (°C)
Taste Description
Black
1
2.00
4
95
Robust
Green
2
2.50
3
80
Fresh
Herbal
3
3.00
7
95
Varied
Oolong
4
4.00
4
85
Floral
White
5
5.00
4
75
Delicate
Pu-erh
6
3.50
4
98
Earthy
Rooibos
7
3.00
6
95
Mild
Yerba Mate
8
2.80
5
75
Bitter
Chamomile
9
2.50
7
95
Soothing
Peppermint
10
2.50
6
95
Refreshing
Average
–
3.08
5.0
88.8
–
True
Data
Tables and charts are small information wonders, as they make complex data understandable at a glance. Tables provide a structured overview of figures, revenues, or statistics, while charts visualize trends, developments, and correlations. Their ability to transform large amounts of data into clear visual representations makes them indispensable.
Precise Tables
Black Tea
Rank (Consumption)
1
Average Price ($)
2.00
Caffeine Strength
Steeping Time (min)
4
Optimal Temperature (°C)
95
Taste Description
Robust
Green Tea
Rank (Consumption)
2
Average Price ($)
2.50
Caffeine Strength
Steeping Time (min)
3
Optimal Temperature (°C)
80
Taste Description
Fresh
Herbal Tea
Rank (Consumption)
3
Average Price ($)
3.00
Caffeine Strength
Steeping Time (min)
7
Optimal Temperature (°C)
95
Taste Description
Varied
Average
Rank (Consumption)
–
Average Price ($)
2.50
Caffeine Strength
Steeping Time (min)
5
Optimal Temperature (°C)
90
Taste Description
–
Treemap
2D
Pie Chart Bar Chart
Relation Line Chart Gantt chart
Pie Chart
Bar Chart
Treemap
2D
Pie Chart Bar Chart
Relation Line Chart Gantt Chart
Pie Chart
Bar Chart
Funnel Column Chart
2D
Area Chart Relation
Process Pie Chart
Area Chart
Relation
Funnel Process
3D
Area Chart Relation
Column Chart Pie Chart
Area Chart
Relation
Smart
Images
Good visual worlds are essential for making projects visually appealing and effective. They create an emotional connection, tell stories, and emphasize your company’s messages. They support audience engagement, convey your values, and make content more accessible and memorable. Visual coherence and high quality also enhance trust and brand recognition.
Moodboard
A mood board helps define the visual direction for a new imagery concept. It serves as a source of inspiration, showcasing moods, colors, image styles, and compositions that align with your brand.
Photographer/ Pictures
Once you have decided on a new imagery concept, there are three ways to obtain the images, to ensure that your visuals perfectly match your brand identity:
You already have a photographer.
We find the right photographer for you.
We search for and use suitable stock photos.
Requirement catalog
Before a photographer will be capturing the matching images, we first create a „requirement catalog“. This document outlines key aspects the photographer should consider, ensuring that the images align perfectly with the visual direction.
Personalization
Once the final photos are available, we personalize them to stand out visually. This can include several adjustments, e.g. retouching, adding branding elements, or integrating graphic overlays.
Your unique image
Friend
Or Foe: AI
Al is a tool that frees up time and space for us, takes care of routine tasks, and opens up new perspectives. It doesn’t replace creative vision-it supports it. When we integrate Al into our work as needed, it can amplify creative potential by providing inspiration and simplifying workflows. Al: use it wisely.
Video Text
Image Generation
Code Voice
/imagine realistic photography, snapshot, indoor, woman in lab coat, works with test tubes in a modern laboratory, ceiling and equiptment lights, some green plants in the background, sunlight from outside, soft, even light on her face and coat, calm composed focused expression, photorealistic, Canon EOS 5D Mark IV DSLR, f/5.6 aperture, 1/125 second shutter speed, ISO 100, shallow-focus, capture the details crisply while softly blurring the background, soft blue lights enhancing background, ambient and studio light, high-resolution –style raw –v 6.1 –ar 16:9
Friend
Or Foe: AI
Al is a tool that frees up time and space for us, takes care of routine tasks, and opens up new perspectives. It doesn’t replace creative vision-it supports it. When we integrate Al into our work as needed, it can amplify creative potential by providing inspiration and simplifying workflows. Al: use it wisely.
Video Text
Image Generation
Code Voice
A Selection
of
our Clients
A Selection of
our Clients
Happy with this individualized mock annual report, made just for you? Then do get in touch!
We would love to turn your annual report into a visually appealing, well-structured masterpiece that leaves a lasting impression!